
The Hidden Pitfall in Survey Design
Surveys seem simple—ask a question, get an answer, analyze the data. But the reality? Small choices in survey design can have a huge impact on the quality of your insights.
One of the most overlooked decisions is choosing even vs. odd-numbered response scales (e.g., a 4-point scale vs. a 5-point scale). It sounds minor, but this choice can change how your data is interpreted and what decisions get made based on it.
So, which is the right approach? It depends—but you need to know the trade-offs.
Even vs. Odd: What’s the Difference?
At its core, the difference is whether you give respondents a middle, “neutral” option or force them to lean one way or the other.
Odd-numbered scales (e.g., 1-3, 1-5, 1-7, etc.)
- Include a neutral midpoint (e.g., “Neither Agree nor Disagree”).
- Good for: When neutrality is a valid response (e.g., “How do you feel about a new policy?”).
Even-numbered scales (e.g., 1-4, 1-6, 1-10, etc.)
- Remove the neutral option, forcing respondents to take a stance.
- Good for: When you need to push people to take a position (e.g., “Would you recommend this program?”).
The Trade-Offs You Need to Know
- Even scales work well when you need to make a decision—but they don’t let you measure true neutrality.
- Odd scales are great for nuanced feedback—but too many neutral responses can dilute insights.
The wrong scale can skew your data, making results harder to interpret. If people feel “pushed” into a response that doesn’t reflect their true opinion, it creates false insights.
The Math Problem: Why Even Scales Can’t Be Averaged
Let’s talk about a common mistake that happens when using even-numbered scales: trying to calculate an average score.
The issue? Even-numbered scales don’t have equal spacing between responses—which means the data isn’t truly numeric.
Example:
Imagine a 4-point scale:
- Strongly Disagree
- Somewhat Disagree
- Somewhat Agree
- Strongly Agree
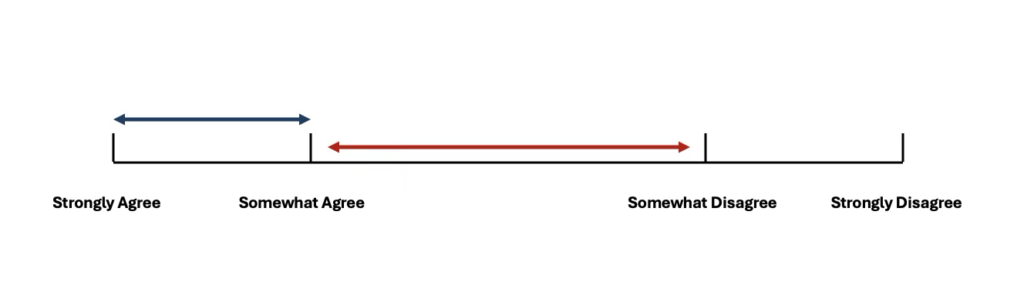
Problem: The distance between Strongly Disagree → Somewhat Disagree is not the same as the distance between Somewhat Disagree → Somewhat Agree. There’s no true midpoint, which means you can’t calculate an average score meaningfully.
Solution: Instead of calculating an average, use favorability scores (e.g., “% of respondents who agreed”)—this gives a more accurate read on the data.
How to Choose the Right Scale for Your Survey
So, how do you decide which approach to use? Ask yourself:
Does neutrality matter?
- If yes, use an odd-numbered scale to allow for true neutrality.
- If no, use an even-numbered scale to force a stance.
Will I need to calculate an average?
- If yes, use an odd-numbered scale with evenly spaced options.
- If no, an even scale may be fine—just don’t average it.
What’s the risk of false insights?
- If respondents might not have a strong opinion, forcing them to pick a side could distort results.
Small Changes, Big Impact
Choosing the right scale might seem like a tiny detail, but it directly impacts the accuracy of your insights. And in education, where data drives key decisions, getting it right matters.
At Ibis Public Sector, we help organizations design surveys that produce meaningful, reliable insights. Whether you’re measuring faculty engagement, student experience, or community feedback, the right survey structure ensures you’re working with the best possible data.
